Sales Dashboard Project
My Project
Project Title: Sale Dashboard Project
Status : Completed
Real-time data , Structured data , Qualitative and Quantitative data
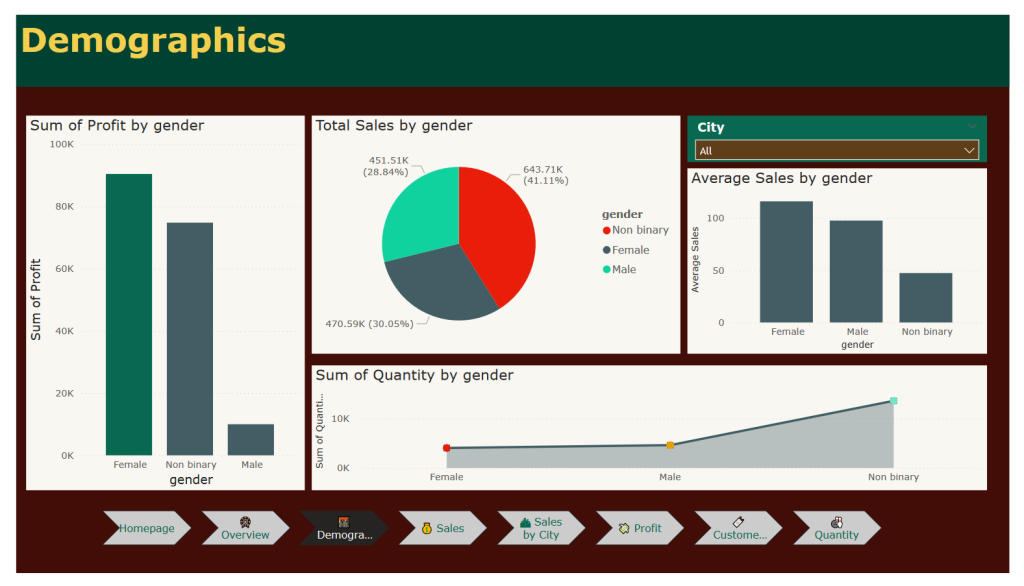
This project showcases an interactive sales report built using Power BI. The dataset used for this report is sourced from Kaggle and is based on a Superstore’s sales data. You can find the dataset here: Superstore Dataset on Kaggle.
Dataset Overview
The dataset includes the following columns:
Order ID
Order Date
Ship Date
Ship Mode
Customer ID
Customer Name
Segment
Country
City
State
Region
Product ID
Category
Sub-Category
Product Name
Sales
Quantity
Profit
Returns
Payment Mode
Power BI Report Features
In this Power BI report, I developed several pages and features:
Overview Page: Provides a high-level summary of the key metrics.
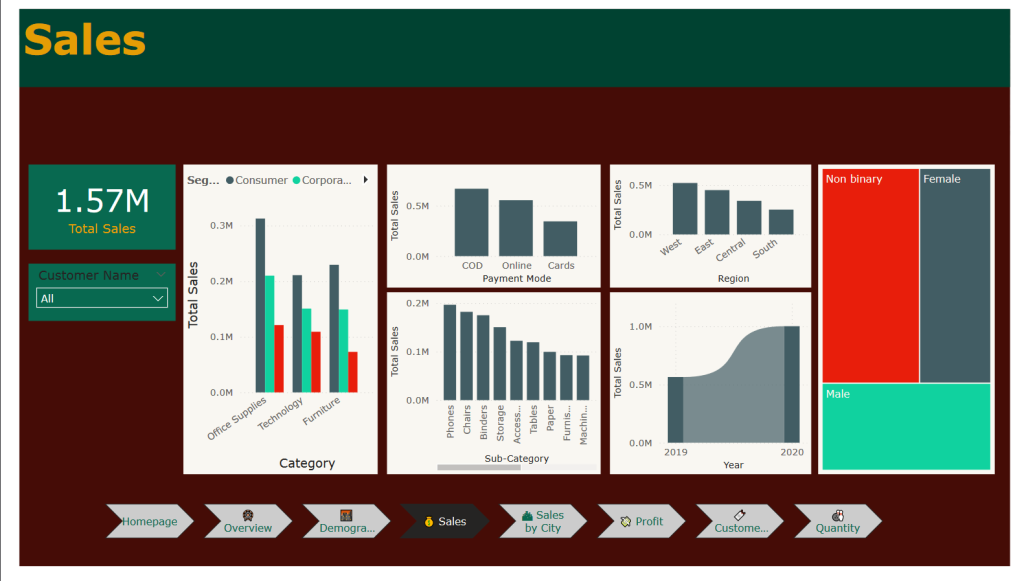
Sales Analysis: Detailed breakdown of sales performance.
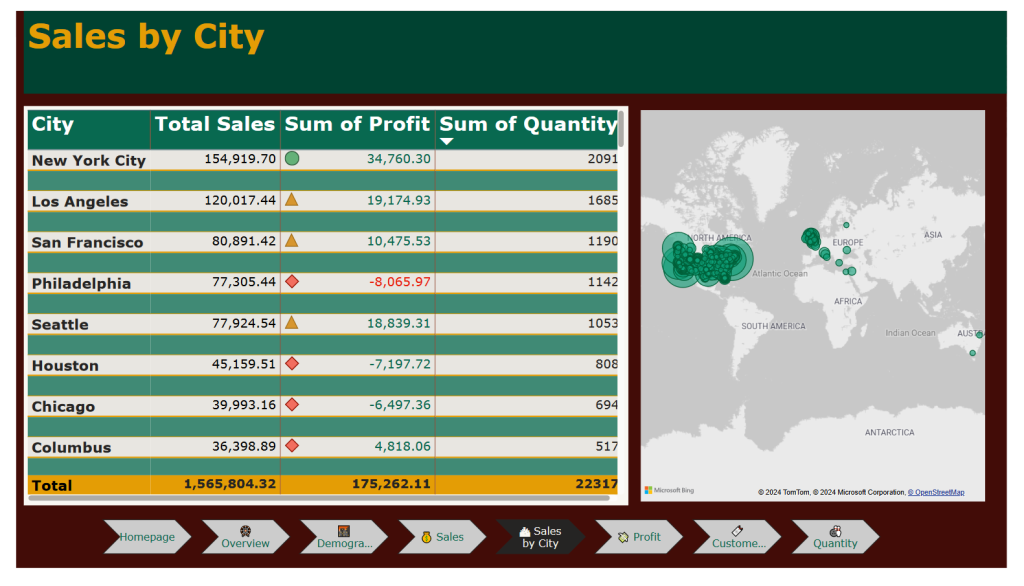
Sales by City: Visualization of sales distribution across different cities.
Profit Analysis: Insights into profit margins and drivers.
Quantity Analysis: Tracks the quantity of products sold.
Navigation and User Experience.
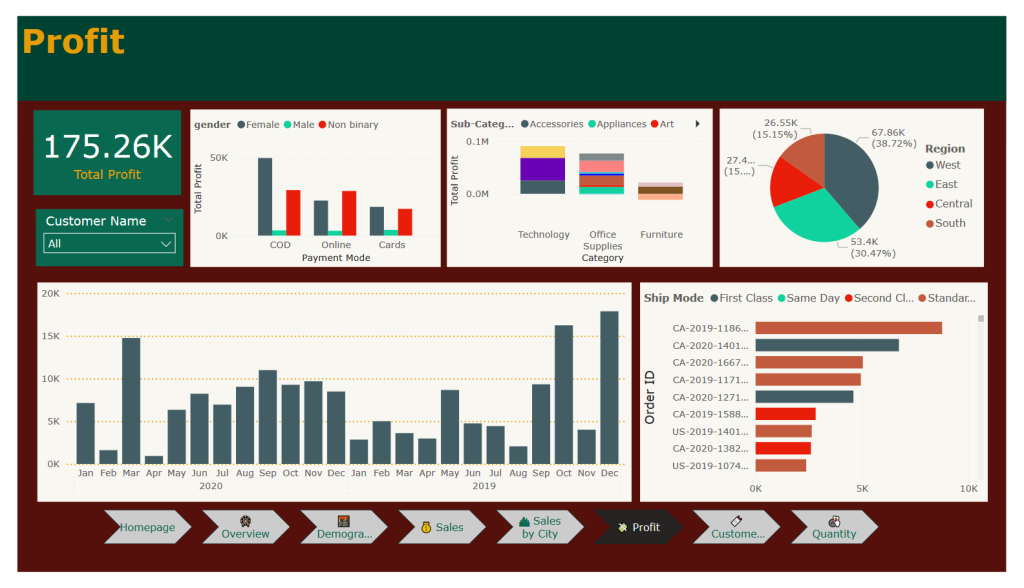
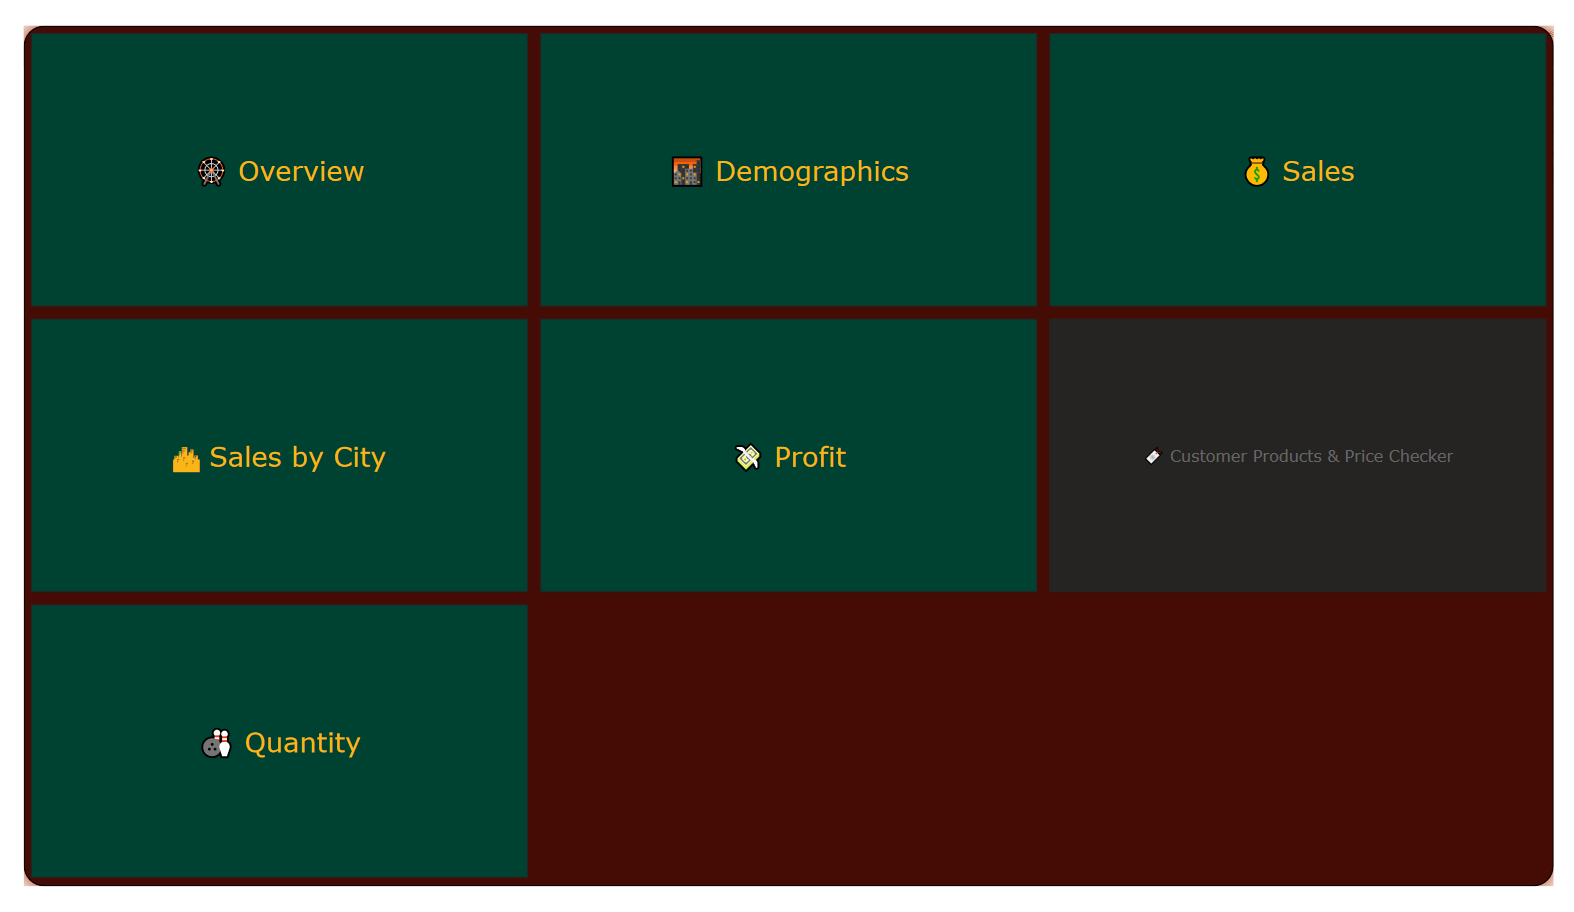
To enhance the user experience, I implemented Power BI bookmarks and navigation features to create a streamlined homepage interface, allowing users to easily switch between different report pages.
To view the project in more detail, please click on the View More Button