In the Sales Analysis project, I used Python to clean, analyze, and visualize data from a sales dataset containing 11 columns. The dataset includes key attributes related to product purchases, and I worked with the following columns:
Order ID: A unique identifier for each order placed. Product: The item that was purchased. Quantity Ordered: The number of units of the product ordered. Price Each: The price of a single unit of the product. Order Date: The date the order was placed. Purchase Address: The shipping address for the order. Derived Attributes: In addition to the provided columns, I derived new attributes for further analysis:
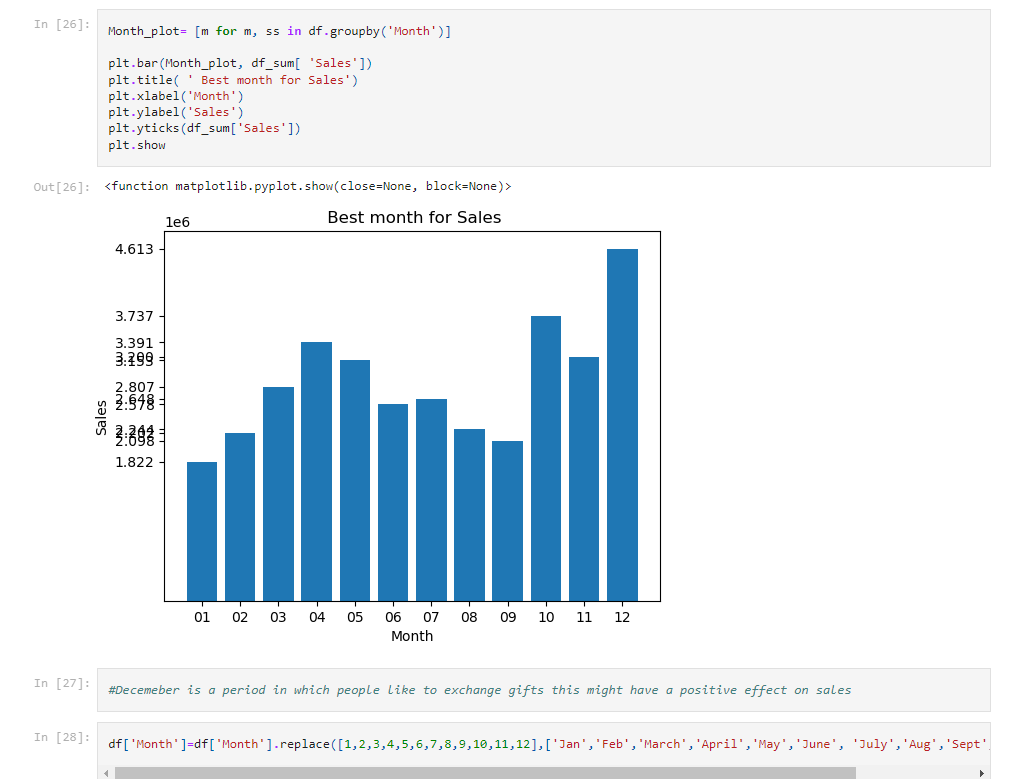
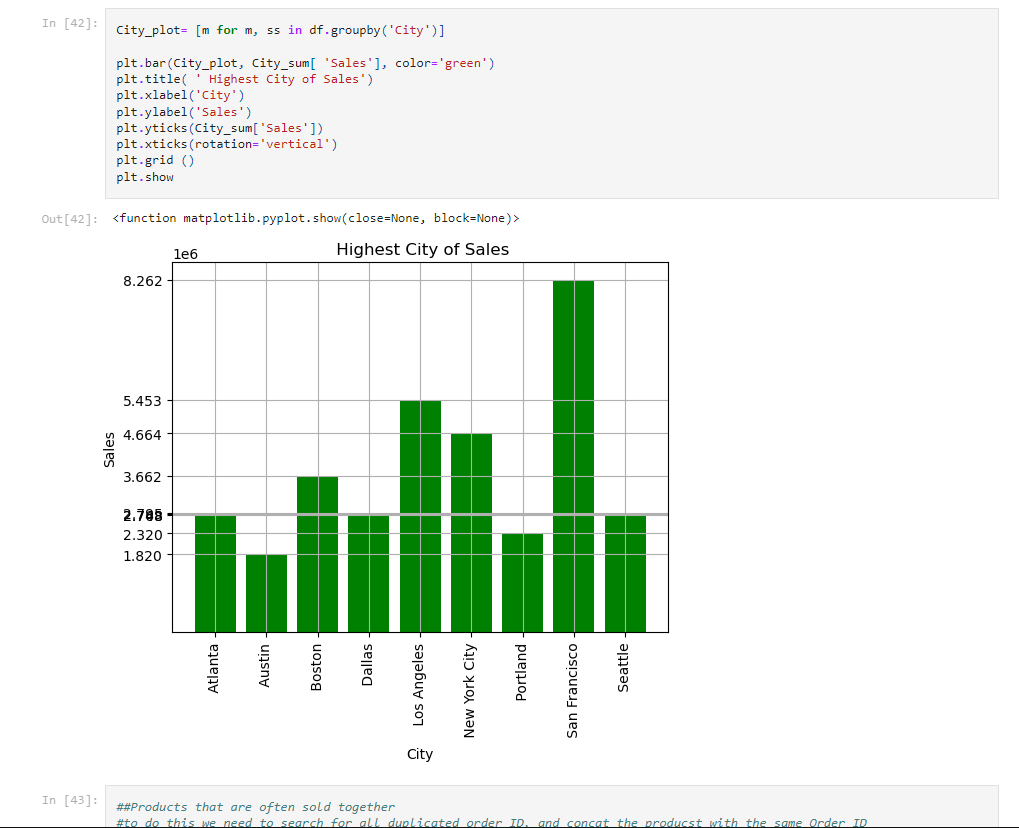
Month: Extracted from the order date. Sales: Calculated by multiplying the price per unit by the quantity ordered. City: Extracted from the purchase address. Hour: Extracted from the order date to analyze purchase patterns by time. These attributes helped in better understanding sales trends, identifying the best-selling products, popular cities for sales, and the most frequent times for purchases.
To view the project in more detail, please click on the View More Button