Revenue Growth & Marketing Impact Analysis

My Project
Project Title: Revenue Growth & Marketing Impact Analysis
Status : Completed
Real-time data , Structured data , Qualitative and Quantitative data

Sales marketing project: In today’s competitive landscape, understanding revenue growth and the impact of marketing campaigns is critical for informed decision-making. This project offers a deep dive into various revenue streams, customer behaviours, and marketing efforts to provide actionable insights that drive business success.
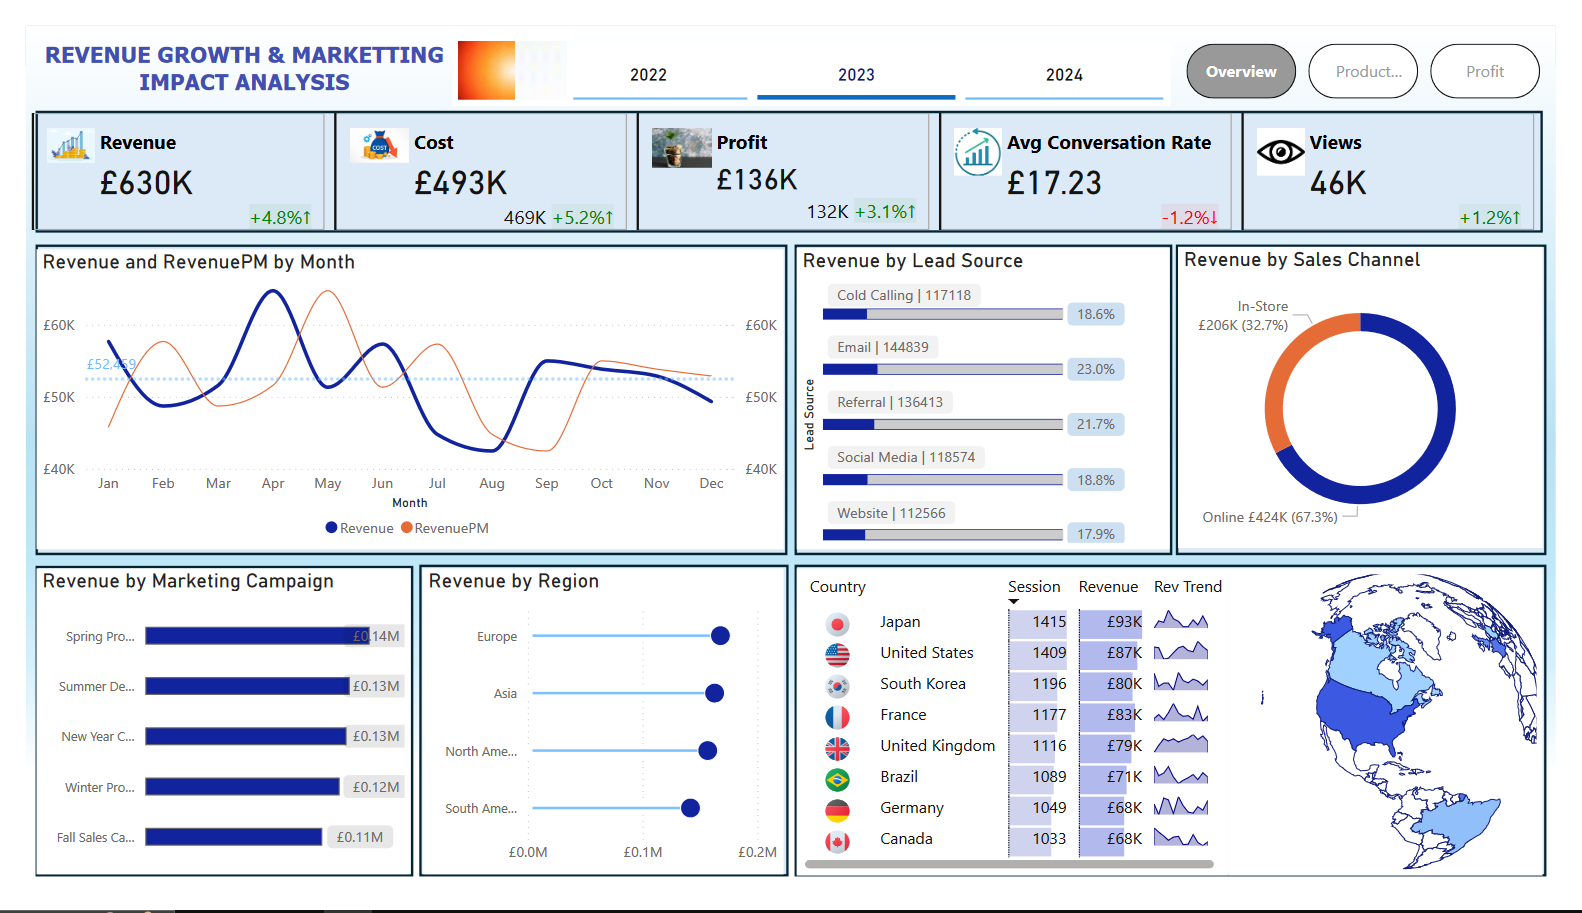
Revenue Trends Analysis, Line Charts Used to compare revenue trends across previous years and months, identifying growth patterns and seasonal fluctuations. Lollipop Bar Charts explored revenue performance by marketing campaigns and regions to determine the most effective strategies and areas of focus.
Interactive Tables with SVGs: Analysed revenue trends for each country across the full year, providing a clear and dynamic view of regional performance. Donut Charts; Evaluated revenue distribution across channels, enabling a detailed understanding of customer preferences and purchase behaviours.
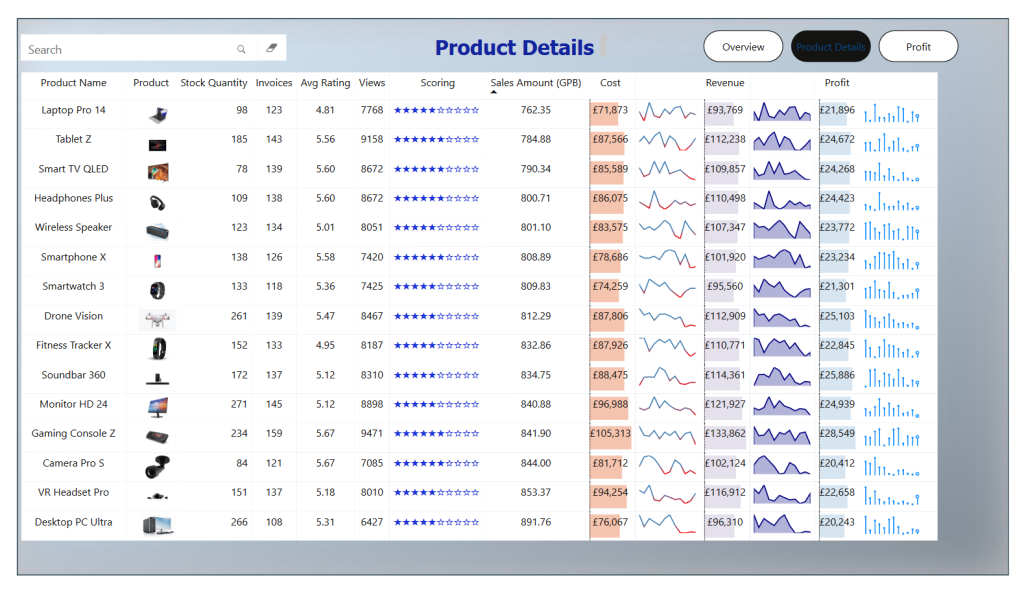
Examined key product attributes such as product name, stock quantity, invoices, average ratings, views, scoring, and sales amounts; Monitored cost, revenue, and profit trends over the year for individual products.

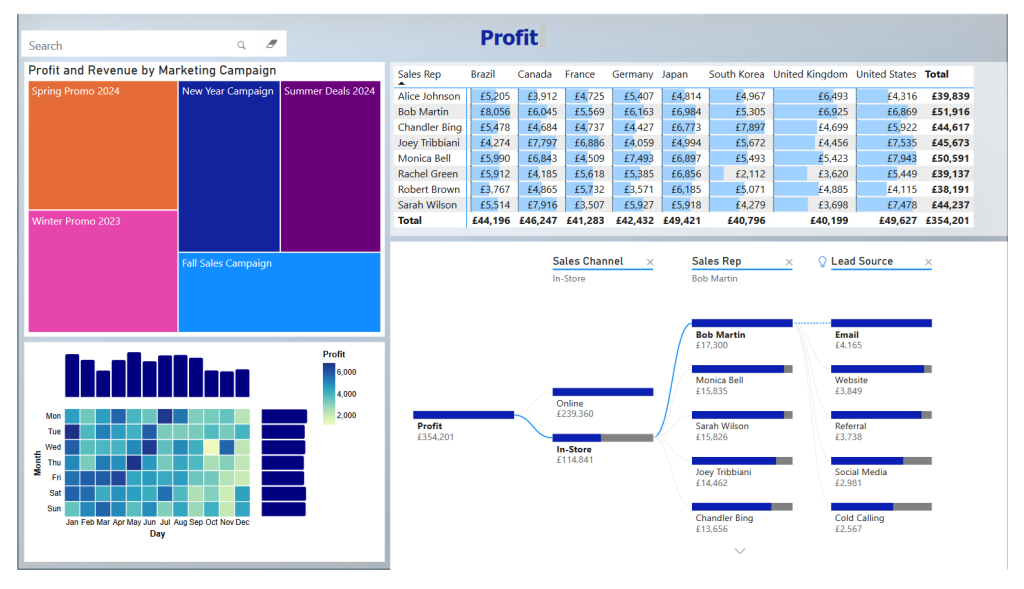
Deneb Function: Identified the highest profit days and months, providing granular insights for strategic planning; Tree maps: Assessed profit contributions from sales channels, representatives, and lead sources to uncover hidden opportunities for growth.
Analysed profits by country to understand the impact of individual sales representatives in various regions, ensuring optimal resource allocation; This comprehensive analysis highlights key growth drivers and areas for improvement, helping businesses enhance their revenue generation and marketing ROI. With advanced visualizations and detailed metrics, the project ensures a clear understanding of performance dynamics for sustainable success.