Netflix Project

My Project
Project Title: Netflix Project
Status : Completed
Qualitatiive data , big data , structured data

This project involves an in-depth analysis of Netflix’s 2022 content library, focusing on several key attributes: genre, movie length, content type (movies vs. TV shows), and the number of seasons for TV series. By exploring these aspects, we aim to uncover patterns and trends in Netflix’s content offerings, providing insights that could be valuable for both viewers and content creators.
Data Sources
The dataset used in this analysis is sourced from Kaggle’s Netflix Movies, which includes information on various attributes of Netflix titles, such as genre, duration, type, and number of seasons. The dataset is regularly updated, ensuring that our analysis reflects the current state of Netflix’s library.
Key Metrics and Analysis

Genre Analysis
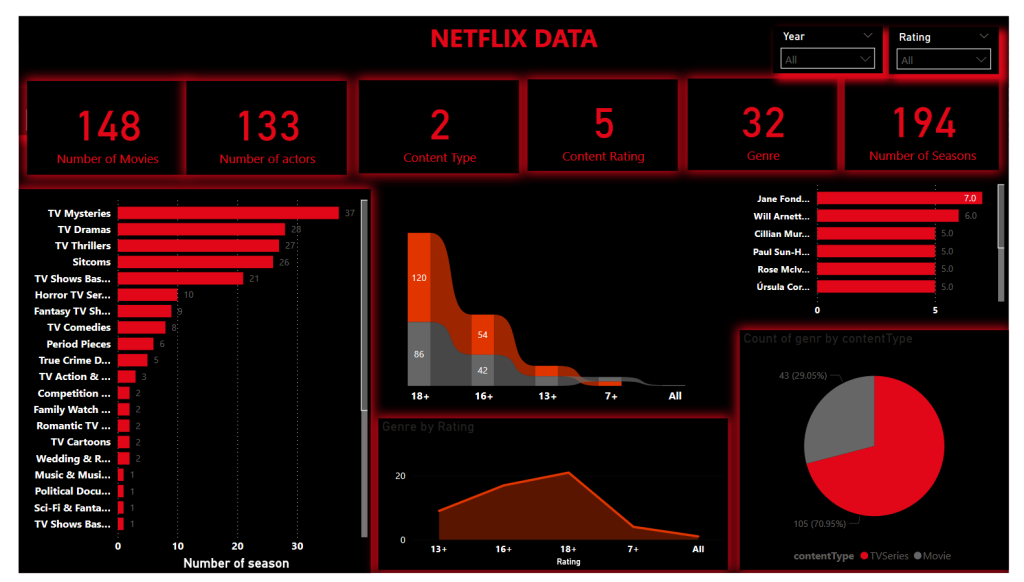
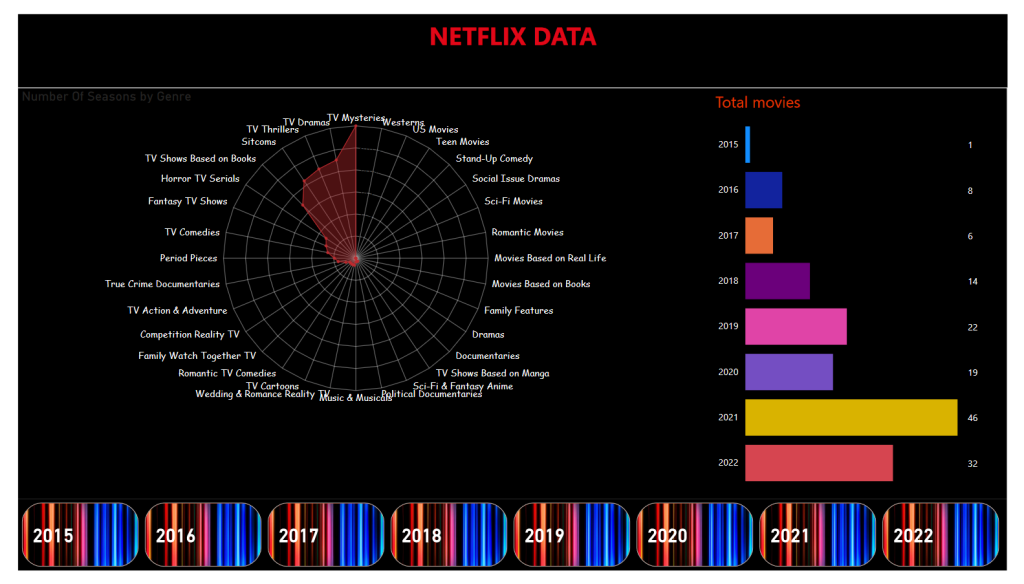
1. Objective: Identify the most popular genres on Netflix.
2. Method: Analyze the frequency of each genre in the dataset and visualize the distribution.
3. Insights: Determine which genres dominate Netflix’s offerings and identify potential gaps or areas of overrepresentation.
Movie Length Analysis
1. Objective: Understand the typical duration of movies on Netflix.
2. Method: Calculate the average, median, and range of movie lengths. Create histograms to visualize the distribution of movie lengths.
3. Insights: Identify common length categories (e.g., under 90 minutes, 90-120 minutes, over 120 minutes) and assess how these might correlate with viewer preferences or genre types.
Content Type Analysis (Movies vs. TV Shows)
1. Objective: Compare the proportion of movies to TV shows on Netflix.
2. Method: Count the number of movies and TV shows in the dataset and visualize the proportion using pie charts or bar graphs.
3. Insights: Evaluate the balance between movies and TV shows in Netflix’s catalogue and understand trends in content type preferences.

Number of Seasons Analysis
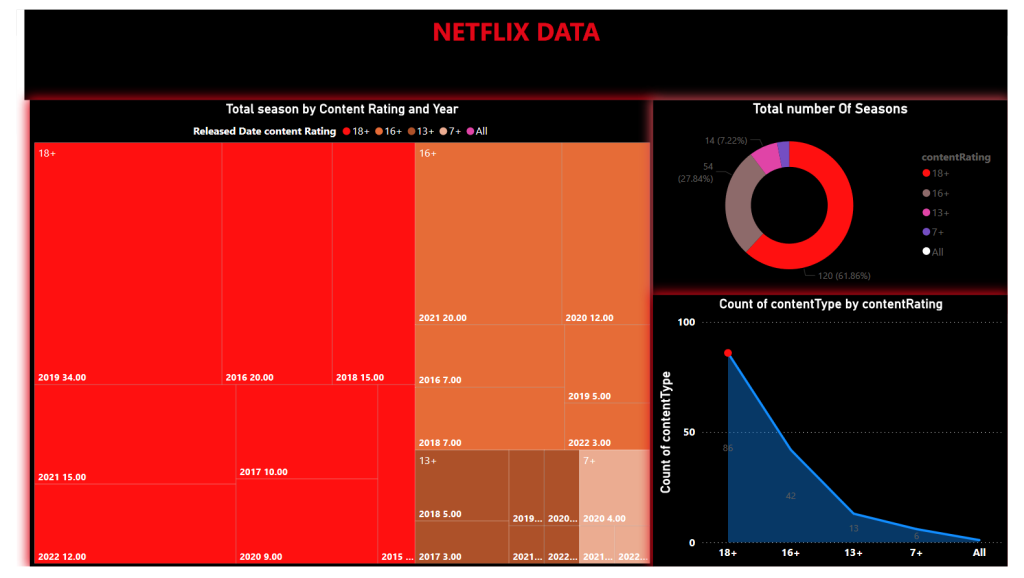
1. Objective: Examine the distribution of the number of seasons for TV series.
2. Method: Analyze the number of seasons for each TV series, calculating averages and identifying outliers. Use bar graphs or histograms to illustrate the distribution.
3. Insights: Determine common season lengths and identify whether there is a trend toward shorter or longer TV series on Netflix.
Tools and Technologies
1. Python: Primary language for data analysis.
2. MSQL: For data manipulation and analysis.
3. Power BI: For data visualization.
Project Structure
1. Data Cleaning: Handling missing values, correcting data types, and preparing the dataset for analysis.
2. Exploratory Data Analysis (EDA): Initial exploration to understand data distribution and key characteristics.
3. Detailed Analysis: In-depth analysis of each key metric.
4. Visualization: Creating informative charts and graphs to present findings.
5. Conclusion: Summarizing key insights and potential implications for Netflix’s content strategy.

Conclusion
This analysis provides a comprehensive look at Netflix’s content library through various lenses, offering insights into genre popularity, movie lengths, content type distribution, and TV series season lengths. These insights can help understand Netflix’s content strategy and viewer preferences, potentially guiding future content creation and acquisition decisions.
To view the interactive dashboard click on View More Below